splnr_plot_solution() allows to plot the solution of a prioritizr conservation problem with our without in a customisable way using ggplot2. This function requires a solution as an sf object with a column called solution_1 and outputs a ggobject. It can be combined with the spatialplanr function splnr_gg_add().
Arguments
- soln
The
prioritizrsolution- colorVals
A
listobject of named vectors that will match the color value with the according name. "TRUE" stands for selected planning units.- showLegend
A logical command on whether to show the legend of the solution (Default: TRUE).
- legendLabels
Character values (number of zones + 1) of what the legend should be labelled.
- plotTitle
A character value for the title of the plot. Can be empty ("").
- legendTitle
A character value for the title of the legend. Can be empty ("").
- zones
A logical value, indicating whether the spatial plan contains zones or not (default = FALSE).
Examples
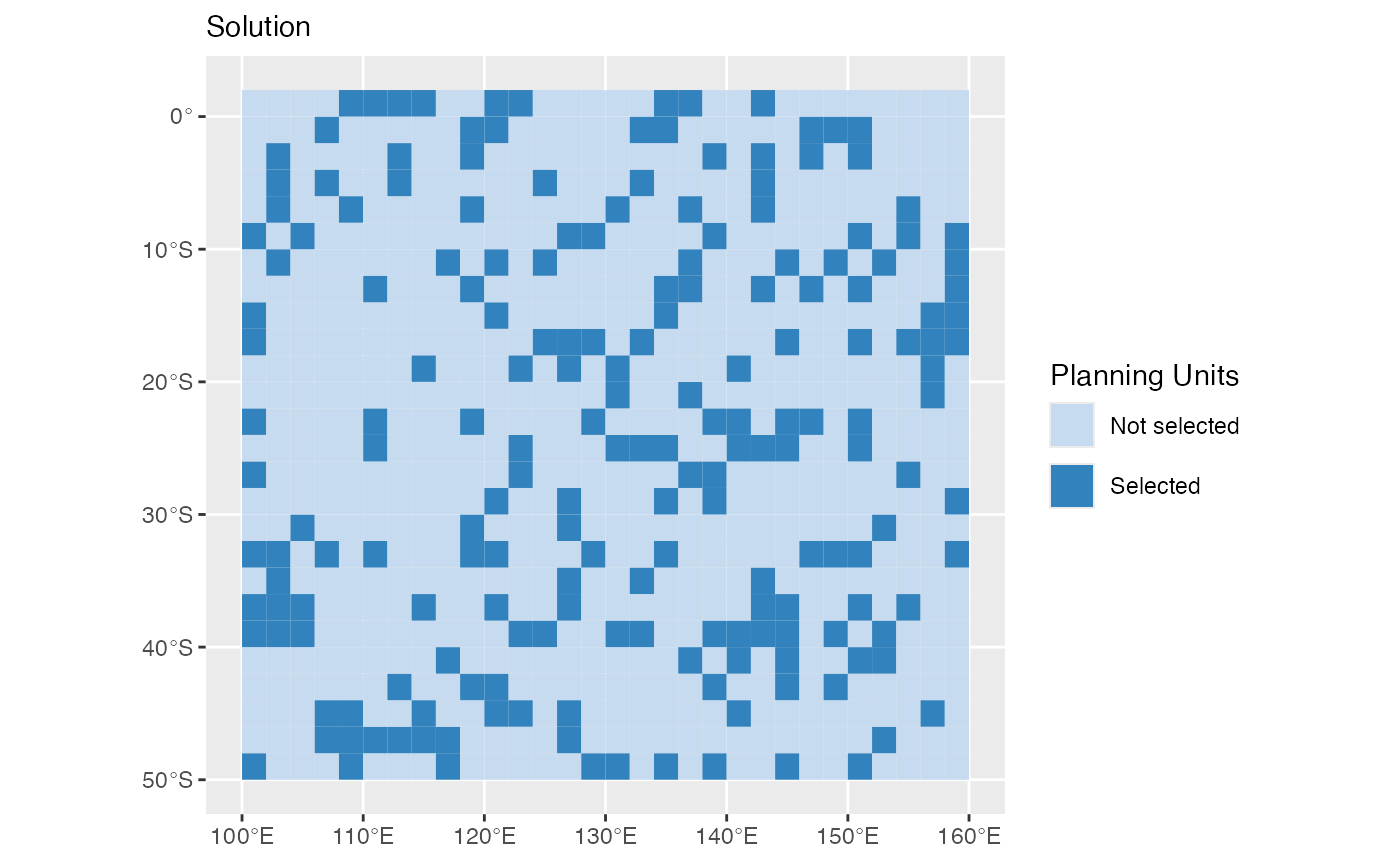
dat_problem <- prioritizr::problem(dat_species_bin %>% dplyr::mutate(Cost = runif(n = dim(.)[[1]])),
features = c("Spp1", "Spp2", "Spp3", "Spp4", "Spp5"),
cost_column = "Cost"
) %>%
prioritizr::add_min_set_objective() %>%
prioritizr::add_relative_targets(0.3) %>%
prioritizr::add_binary_decisions() %>%
prioritizr::add_default_solver(verbose = FALSE)
dat_soln <- dat_problem %>%
prioritizr::solve.ConservationProblem()
splnr_plot_solution(dat_soln)
 # example 2
t2 <- matrix(NA, ncol = 2, nrow = 5) # create targets
t2[, 1] <- 0.1
t2[, 2] <- 0.05
z2 <- prioritizr::zones(
"zone 1" = c("Spp1", "Spp2", "Spp3", "Spp4", "Spp5"),
"zone 2" = c("Spp1", "Spp2", "Spp3", "Spp4", "Spp5")
)
# when giving sf input, we need as many cost columns as we have zones
p2 <- prioritizr::problem(
dat_species_bin %>% dplyr::mutate(
Cost1 = runif(n = dim(.)[[1]]),
Cost2 = runif(n = dim(.)[[1]])
),
z2,
cost_column = c("Cost1", "Cost2")
) %>%
prioritizr::add_min_set_objective() %>%
prioritizr::add_relative_targets(t2) %>%
prioritizr::add_binary_decisions() %>%
prioritizr::add_default_solver(verbose = FALSE)
s2 <- p2 %>%
prioritizr::solve.ConservationProblem()
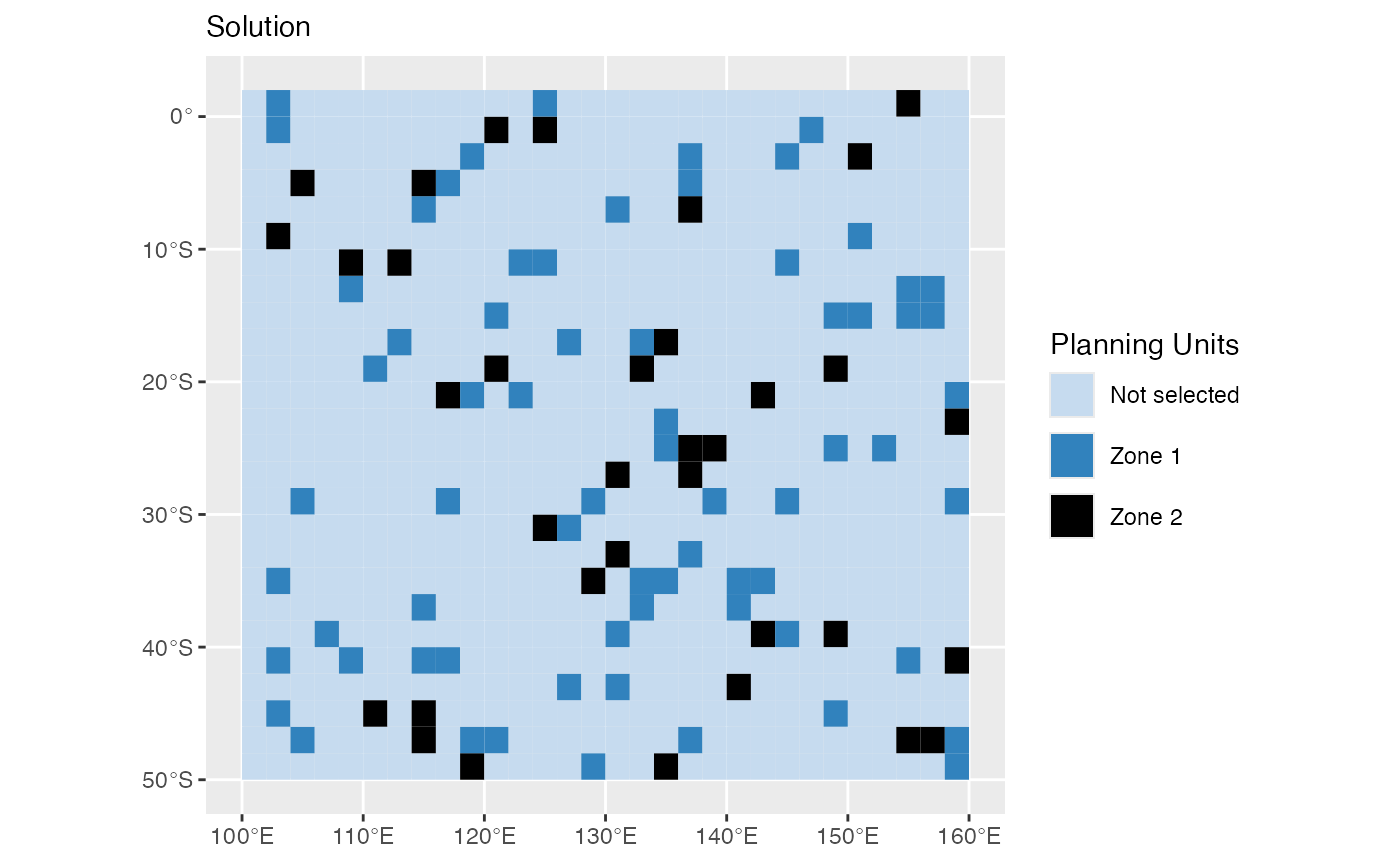
(splnr_plot_solution(s2,
zones = TRUE, colorVals = c("#c6dbef", "#3182bd", "black"),
legendLabels = c("Not selected", "Zone 1", "Zone 2")
))
# example 2
t2 <- matrix(NA, ncol = 2, nrow = 5) # create targets
t2[, 1] <- 0.1
t2[, 2] <- 0.05
z2 <- prioritizr::zones(
"zone 1" = c("Spp1", "Spp2", "Spp3", "Spp4", "Spp5"),
"zone 2" = c("Spp1", "Spp2", "Spp3", "Spp4", "Spp5")
)
# when giving sf input, we need as many cost columns as we have zones
p2 <- prioritizr::problem(
dat_species_bin %>% dplyr::mutate(
Cost1 = runif(n = dim(.)[[1]]),
Cost2 = runif(n = dim(.)[[1]])
),
z2,
cost_column = c("Cost1", "Cost2")
) %>%
prioritizr::add_min_set_objective() %>%
prioritizr::add_relative_targets(t2) %>%
prioritizr::add_binary_decisions() %>%
prioritizr::add_default_solver(verbose = FALSE)
s2 <- p2 %>%
prioritizr::solve.ConservationProblem()
(splnr_plot_solution(s2,
zones = TRUE, colorVals = c("#c6dbef", "#3182bd", "black"),
legendLabels = c("Not selected", "Zone 1", "Zone 2")
))