Plot selection frequency of a planning unit in an array of prioritisations
Source:R/splnr_plotting.R
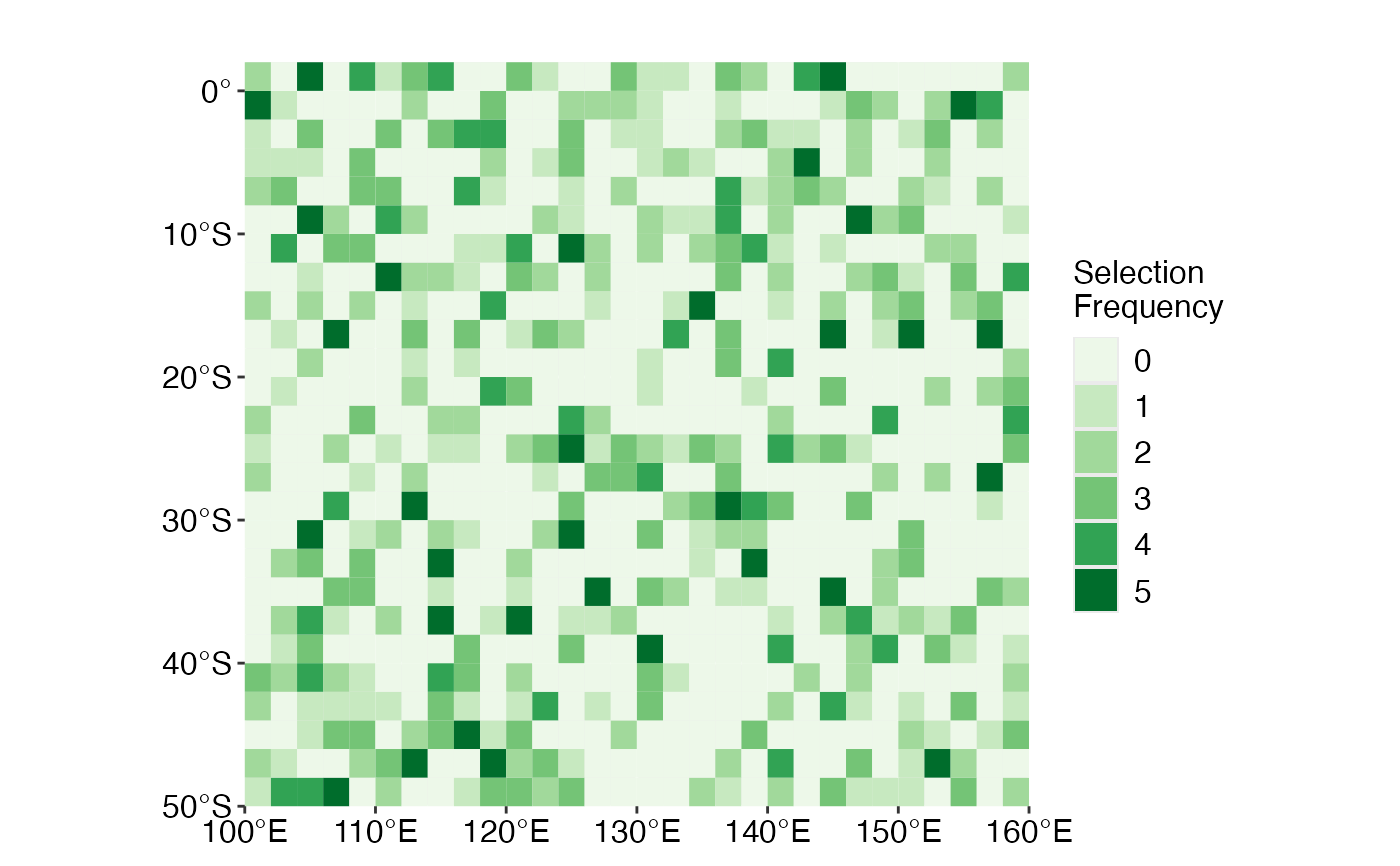
splnr_plot_selectionFreq.RdWhen multiple spatial plans are generated, we are often interested in how many times a planning unit is selected across an array of solutions. This array can either be made up of the solutions to different conservation problems or generated through a portfolio approach with prioritizr.
Either way, this function requires an sf object input that contains a column (selFreq) with the selection frequency of each planning unit that can be generated with the spatialplanrfunction splnr_get_selFreq(). splnr_plot_selectionFreq() allows to visualize this selection frequency using ggplot2. It outputs a ggobject and can be combined with the spatialplanr function splnr_gg_add().
Usage
splnr_plot_selectionFreq(
  selFreq,
  plotTitle = "",
  paletteName = "Greens",
  legendTitle = "Selection \nFrequency"
)
Arguments
- selFreq
An
sfobject containing the selection frequency of a planning unit from an array of solutions- plotTitle
A character value for the title of the plot. Can be empty ("").
- paletteName
A string (or number) for the color palette to use. Available palettes can be found at https://ggplot2.tidyverse.org/reference/scale_brewer.html.
- legendTitle
A character value for the title of the legend. Can be empty ("").
Examples
dat_problem <- prioritizr::problem(dat_species_bin %>% dplyr::mutate(Cost = runif(n = dim(.)[[1]])),
  features = c("Spp1", "Spp2", "Spp3", "Spp4", "Spp5"),
  cost_column = "Cost"
) %>%
  prioritizr::add_min_set_objective() %>%
  prioritizr::add_relative_targets(0.3) %>%
  prioritizr::add_binary_decisions() %>%
  prioritizr::add_default_solver(verbose = FALSE)

# create conservation problem that contains a portfolio of solutions
dat_soln_portfolio <- dat_problem %>%
  prioritizr::add_cuts_portfolio(number_solutions = 5) %>%
  prioritizr::solve.ConservationProblem()

selFreq <- splnr_get_selFreq(solnMany = dat_soln_portfolio, type = "portfolio")
(splnr_plot_selectionFreq(selFreq))