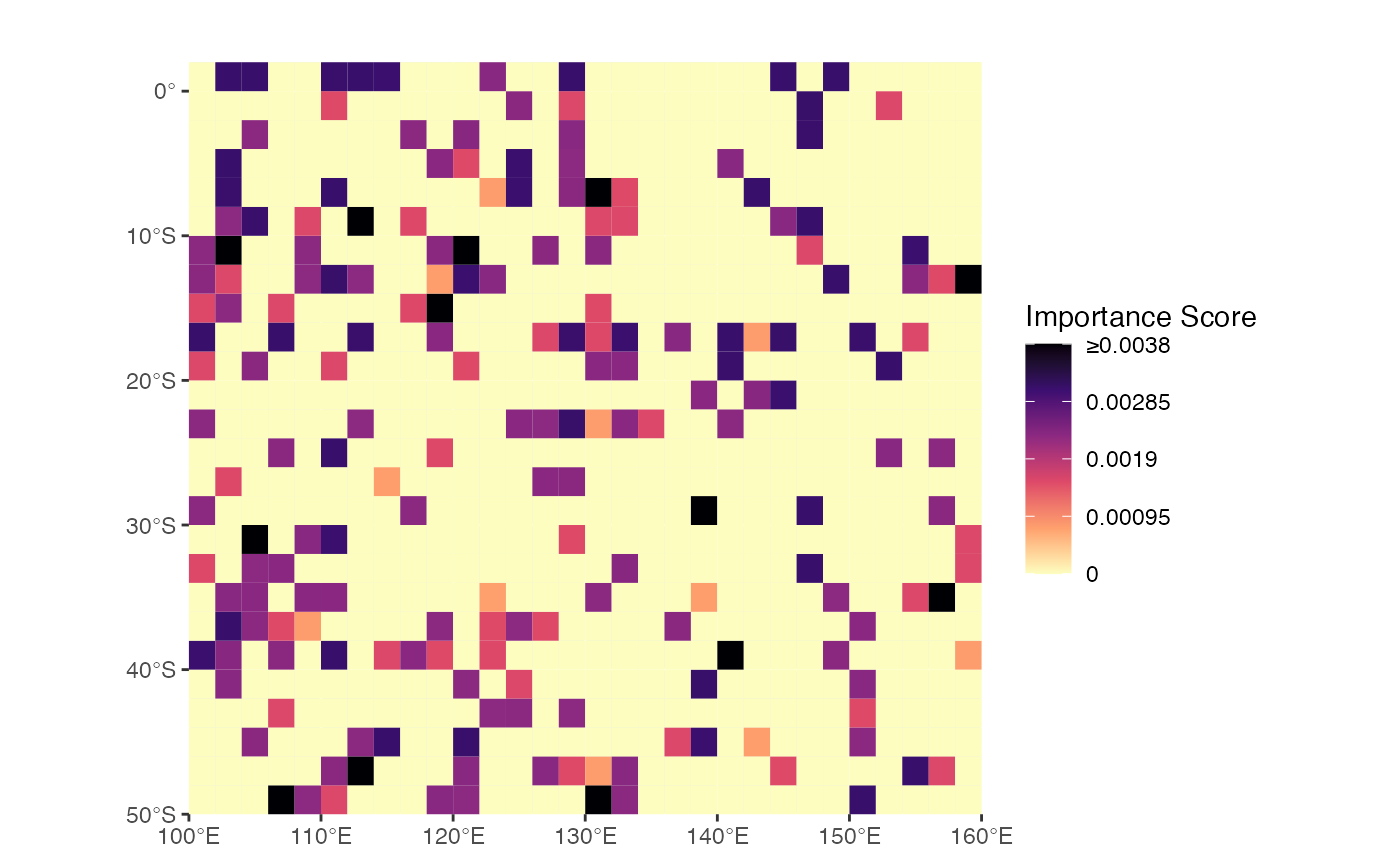
Importance scores are a mean to reflect the irreplaceability of a planning unit in the solution of a prioirtizr conservation problem. Based on the prioritizr package, splnr_plot_importanceScore() allows to visualize three different types of importance scores with ggplot2 that should be used based on the conservation problem at hand. The prioritizr development team generally recommend using the replacement cost score, however this might be not be feasible for conservation problems with many planning units or features.
Usage
splnr_plot_importanceScore(
  soln,
  pDat,
  method = "Ferrier",
  plotTitle = "",
  colorMap = "A",
  decimals = 4,
  legendTitle = "Importance Score"
)
Arguments
- soln
The
prioritizrsolution- pDat
The
prioritizrproblem- method
The method for calcualting importance scores. Can be either "Ferrier" for the Ferrier Score, which can only be used with the minimum set objective function, "RWR" for Rarity Weighted Richness Score, or "RC" for Replacement Cost which takes longer than the other approaches due to its iterative process.
- plotTitle
A character value for the title of the plot. Can be empty ("").
- colorMap
A character string indicating the color map to use (see https://ggplot2.tidyverse.org/reference/scale_viridis.html for all options)
- decimals
The number of decimals shown in the plot. Ferrier Score often requires a higher number of decimals (>4) than the other two approaches (2) for this analysis to work.
- legendTitle
A character value for the title of the legend. Can be empty ("").
Details
The function outputs a ggobject and can be combined with the spatialplanr function splnr_gg_add().
Examples
dat_problem <- prioritizr::problem(dat_species_bin %>% dplyr::mutate(Cost = runif(n = dim(.)[[1]])),
  features = c("Spp1", "Spp2", "Spp3", "Spp4", "Spp5"),
  cost_column = "Cost"
) %>%
  prioritizr::add_min_set_objective() %>%
  prioritizr::add_relative_targets(0.3) %>%
  prioritizr::add_binary_decisions() %>%
  prioritizr::add_default_solver(verbose = FALSE)

dat_soln <- dat_problem %>%
  prioritizr::solve.ConservationProblem()

(splnr_plot_importanceScore(soln = dat_soln, pDat = dat_problem, method = "Ferrier", decimals = 4))
#> Ferrier Score.
#> Warning: conversion failure on '≥0.0038 ' in 'mbcsToSbcs': dot substituted for <e2>
#> Warning: conversion failure on '≥0.0038 ' in 'mbcsToSbcs': dot substituted for <89>
#> Warning: conversion failure on '≥0.0038 ' in 'mbcsToSbcs': dot substituted for <a5>
#> Warning: conversion failure on '≥0.0038 ' in 'mbcsToSbcs': dot substituted for <e2>
#> Warning: conversion failure on '≥0.0038 ' in 'mbcsToSbcs': dot substituted for <89>
#> Warning: conversion failure on '≥0.0038 ' in 'mbcsToSbcs': dot substituted for <a5>

