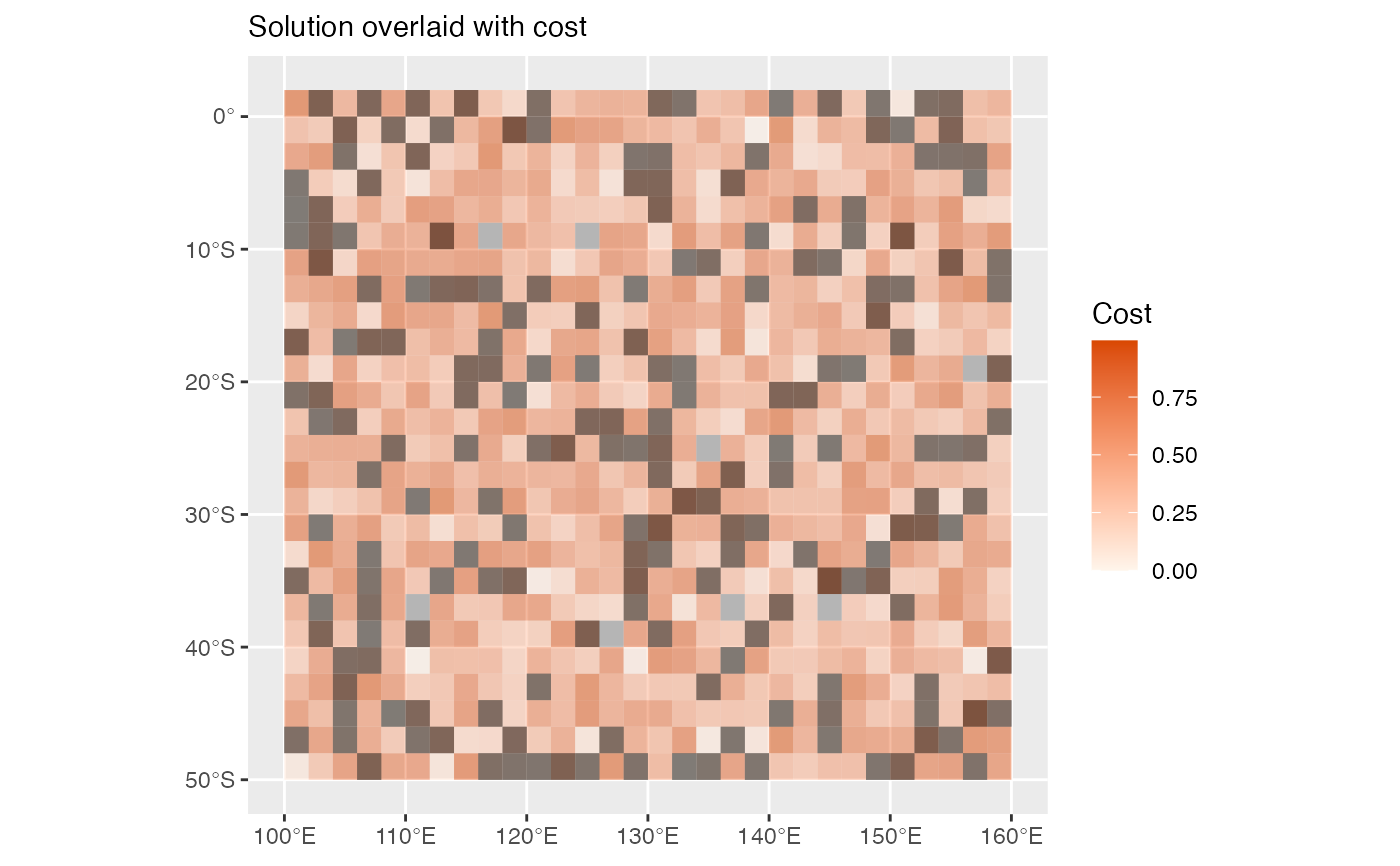
splnr_plot_costOverlay() allows to plot the cost of each planning units of a planning region on top of the solution of a conservation problem created with prioritizr in a customisable way using ggplot2. This function requires a solution as an sf object with a column called solution_1 as well as a cost column and outputs a ggobject. It can be combined with the spatialplanr function splnr_gg_add().
Usage
splnr_plot_costOverlay(
  soln,
  Cost = NA,
  Cost_name = "Cost",
  legendTitle = "Cost",
  plotTitle = "Solution overlaid with cost"
)
Arguments
- soln
The
prioritizrsolution- Cost
An
sfobject of cost forprioritizr.In caseprioritizrsolution does not contain cost, alternative cost object has to be provided here that was used to generate solution (default: NA).- Cost_name
Name of the cost column
- legendTitle
A character value for the title of the legend. Can be empty ("").
- plotTitle
A character value for the title of the plot. Can be empty ("").
Examples
dat_problem <- prioritizr::problem(dat_species_bin %>% dplyr::mutate(Cost = runif(n = dim(.)[[1]])),
  features = c("Spp1", "Spp2", "Spp3", "Spp4", "Spp5"),
  cost_column = "Cost"
) %>%
  prioritizr::add_min_set_objective() %>%
  prioritizr::add_relative_targets(0.3) %>%
  prioritizr::add_binary_decisions() %>%
  prioritizr::add_default_solver(verbose = FALSE)

dat_soln <- dat_problem %>%
  prioritizr::solve.ConservationProblem()

splnr_plot_costOverlay(soln = dat_soln)