A dataset containing the biological parameters for different functional groups used in the ZooMSS size-structured marine ecosystem model. These represent various taxa from flagellates to large fish, each defined by their feeding behavior, size ranges, and physiological parameters.
Format
A data frame with 12 rows (functional groups) and 19 columns:
- Species
Character. Name of the functional group/taxa
- Type
Character. Broad category (Zooplankton or Fish)
- FeedType
Character. Feeding strategy (Heterotroph, FilterFeeder, Omnivore, Carnivore)
- Prop
Numeric. Initial proportion of total biomass
- W0
Numeric. Log10 minimum body weight (g) for the group
- Wmax
Numeric. Log10 maximum body weight (g) for the group
- Wmat
Numeric. Log10 maturation body weight (g)
- SearchCoef
Numeric. Search coefficient for predation interactions
- SearchExp
Numeric. Search exponent for predation scaling
- PPMRscale
Numeric. Predator-prey mass ratio scaling parameter
- PPMR
Numeric. Predator-prey mass ratio (for fish groups)
- FeedWidth
Numeric. Feeding kernel width parameter
- GrossGEscale
Numeric. Gross growth efficiency scaling
- Carbon
Numeric. Carbon content proportion
- Repro
Numeric. Reproduction parameter
- Fmort
Numeric. Fishing mortality rate
- Fmort_W0
Numeric. Log10 minimum weight for fishing mortality
- Fmort_Wmax
Numeric. Log10 maximum weight for fishing mortality
- PlotColour
Character. Color code for plotting the functional group
Details
ZooMSS Functional Groups Data
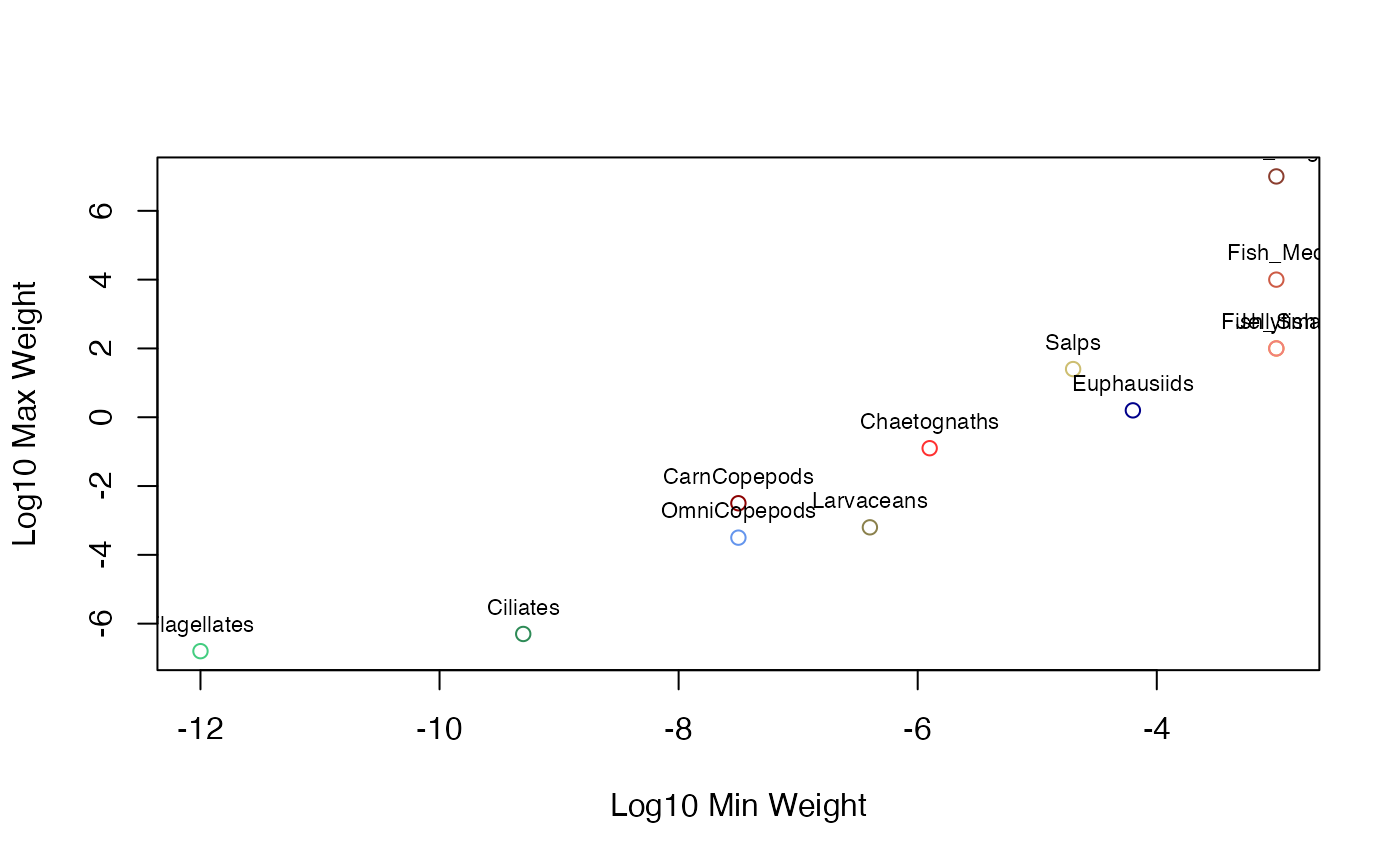
The GroupInputs dataset defines 12 functional groups spanning from small microzooplankton (flagellates, ciliates) through various mesozooplankton groups (copepods, euphausiids, chaetognaths) to gelatinous zooplankton (salps, jellyfish) and three fish size classes (small, medium, large). Each group is characterized by:
Size ranges: W0 to Wmax define the body size spectrum
Feeding behavior: Different strategies for resource acquisition
Interaction parameters: Search rates and predator-prey relationships
Physiological rates: Growth efficiency and carbon content
These parameters are based on marine ecological literature and represent typical values for temperate marine ecosystems.
Examples
data(GroupInputs)
head(GroupInputs)
#> # A tibble: 6 × 19
#>   Species  Type  FeedType  Prop    W0  Wmax  Wmat SearchCoef SearchExp PPMRscale
#>   <chr>    <chr> <chr>    <dbl> <dbl> <dbl> <dbl>      <dbl>     <dbl>     <dbl>
#> 1 Flagell… Zoop… Heterot…  0.1  -12    -6.8  -8.8        640       0.8      1.5
#> 2 Ciliates Zoop… Heterot…  0.1   -9.3  -6.3  -8.3        640       0.8      0.04
#> 3 Larvace… Zoop… FilterF…  0.1   -6.4  -3.2  -5.2        640       0.8     -3
#> 4 OmniCop… Zoop… Omnivore  0.04  -7.5  -3.5  -5.5        640       0.8     -0.5
#> 5 CarnCop… Zoop… Carnivo…  0.06  -7.5  -2.5  -4.5        640       0.8      1.5
#> 6 Euphaus… Zoop… Omnivore  0.1   -4.2   0.2  -1.8        640       0.8     -2
#> # ℹ 9 more variables: PPMR <dbl>, FeedWidth <dbl>, GrossGEscale <dbl>,
#> #   Carbon <dbl>, Repro <dbl>, Fmort <dbl>, Fmort_W0 <dbl>, Fmort_Wmax <dbl>,
#> #   PlotColour <chr>

# View size ranges across groups
plot(GroupInputs$W0, GroupInputs$Wmax,
     col = GroupInputs$PlotColour,
     xlab = "Log10 Min Weight", ylab = "Log10 Max Weight")
text(GroupInputs$W0, GroupInputs$Wmax, GroupInputs$Species, pos = 3, cex = 0.7)