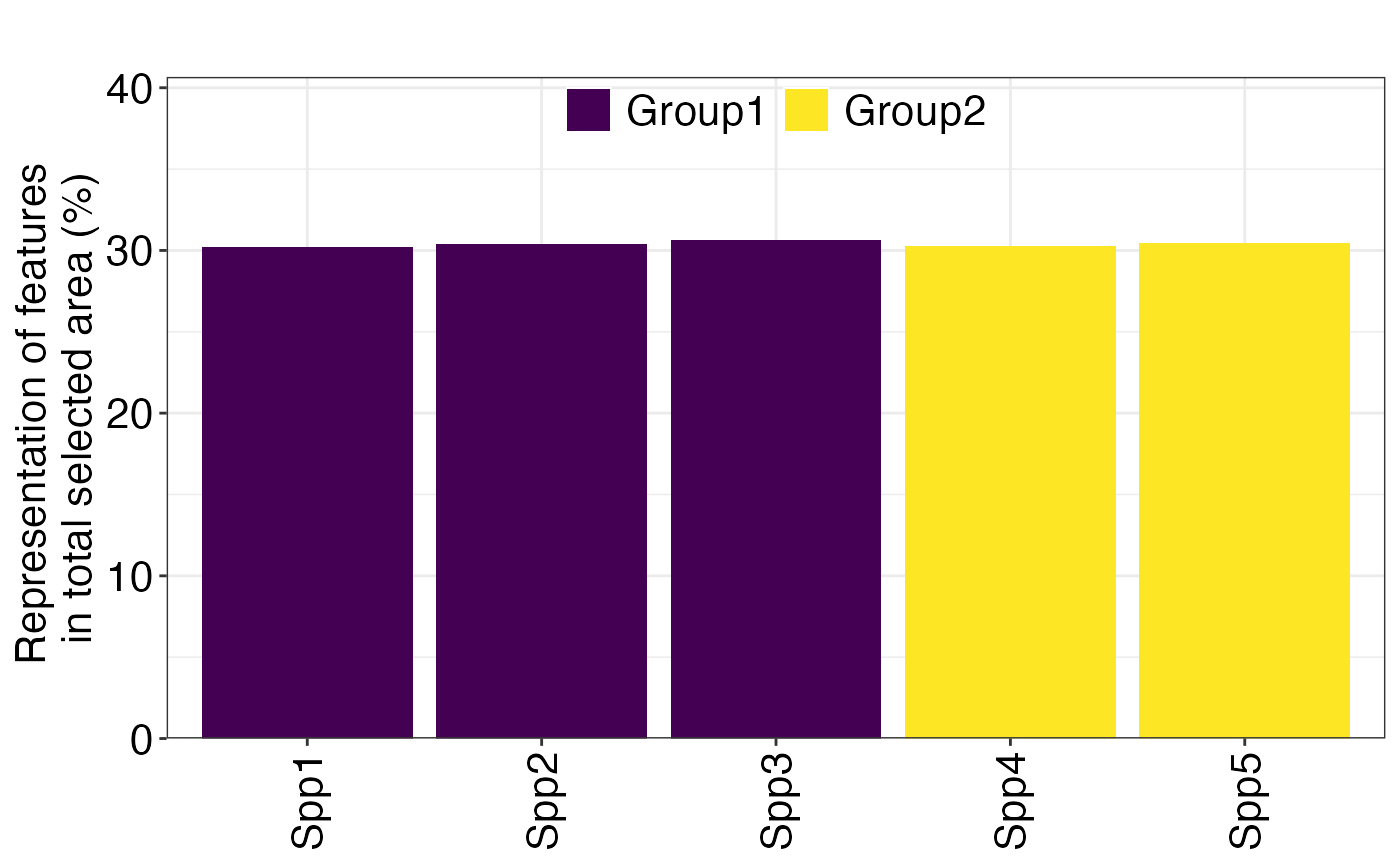
Plot how well targets are met
Usage
splnr_plot_featureRep(
  df,
  category = NA,
  categoryFeatureCol = NA,
  renameFeatures = FALSE,
  namesToReplace = NA,
  nr = 1,
  showTarget = NA,
  plotTitle = "",
  ...
)
Arguments
- df
A
dfcontaining the target information (resulting from the splnr_get_featureRep() function)- category
A named data frame of feature and category for grouping the plot output
- categoryFeatureCol
A character with the column containing the feature infromation to be plotted if the category data frame does not contain a column named 'feature' that can be matched with the 'df' infromation.
- renameFeatures
A logical on whether variable names should be used or they should be replaced with common names
- namesToReplace
A data frame containing the variable name ('nameVariable') and a common name ('nameCommon').
- nr
Number of rows of the legend
- showTarget
logicalShould the targets be shown on the bar plot- plotTitle
A character value for the title of the plot. Can be empty ("").
- ...
Other arguments passed on to
ggplot2::theme()
Examples
pDat <- prioritizr::problem(dat_species_bin %>% dplyr::mutate(Cost = runif(n = dim(.)[[1]])),
  features = c("Spp1", "Spp2", "Spp3", "Spp4", "Spp5"),
  cost_column = "Cost"
) %>%
  prioritizr::add_min_set_objective() %>%
  prioritizr::add_relative_targets(0.3) %>%
  prioritizr::add_binary_decisions() %>%
  prioritizr::add_default_solver(verbose = FALSE)

soln <- pDat %>%
  prioritizr::solve.ConservationProblem()


# including incidental species coverage
df <- splnr_get_featureRep(
  soln = soln,
  pDat = pDat
)

(splnr_plot_featureRep(df, category = dat_category))