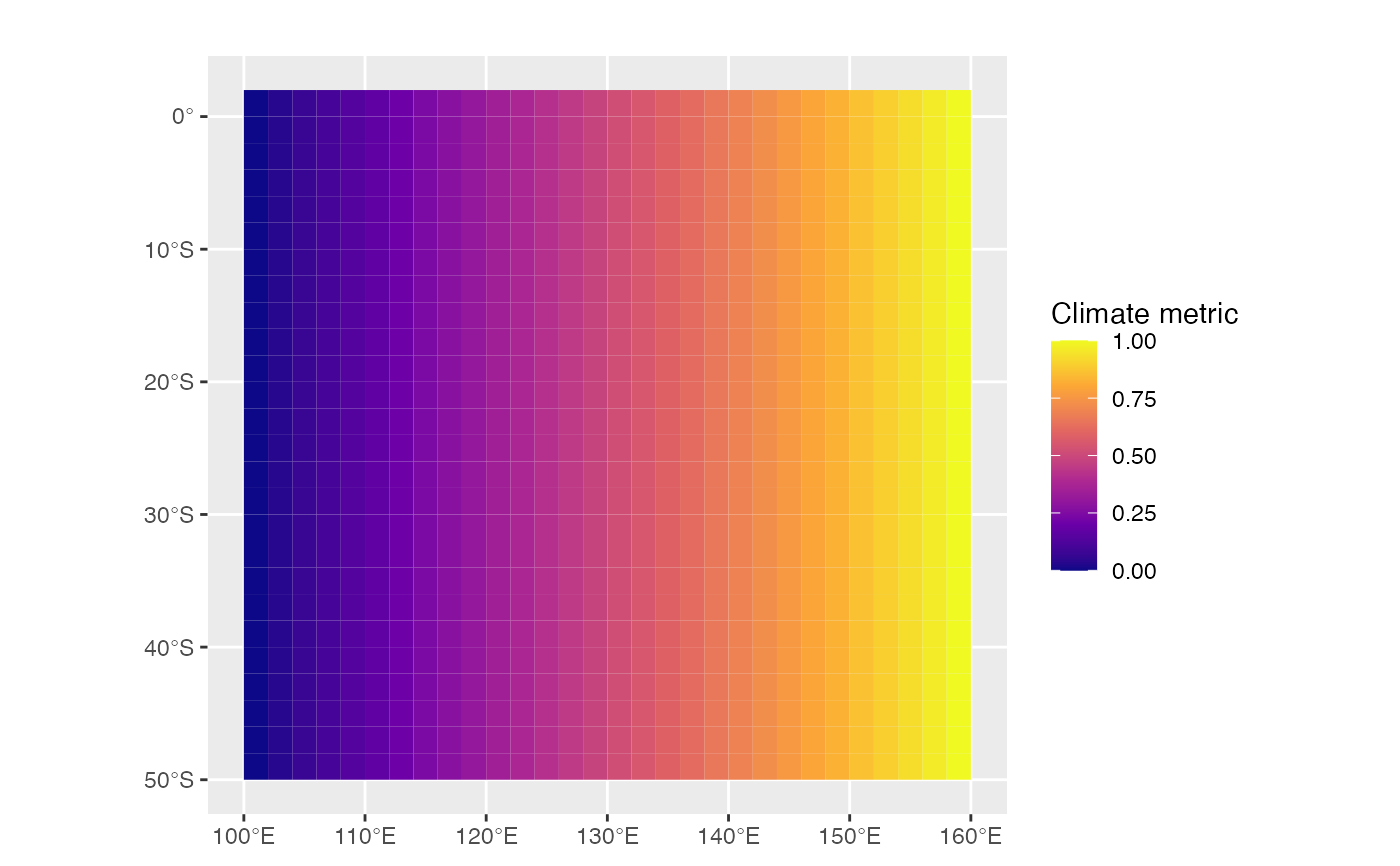
Plot climate data
Usage
splnr_plot_climData(
  df,
  colInterest,
  colorMap = "C",
  plotTitle = " ",
  legendTitle = "Climate metric"
)
Arguments
- df
An
sfobject with climate metric information with- colInterest
column of data frame that contains the metric informatin
- colorMap
A character string indicating the color map to use (see https://ggplot2.tidyverse.org/reference/scale_viridis.html for all options)
- plotTitle
A character value for the title of the plot. Can be empty ("").
- legendTitle
A character value for the title of the legend. Can be empty ("").