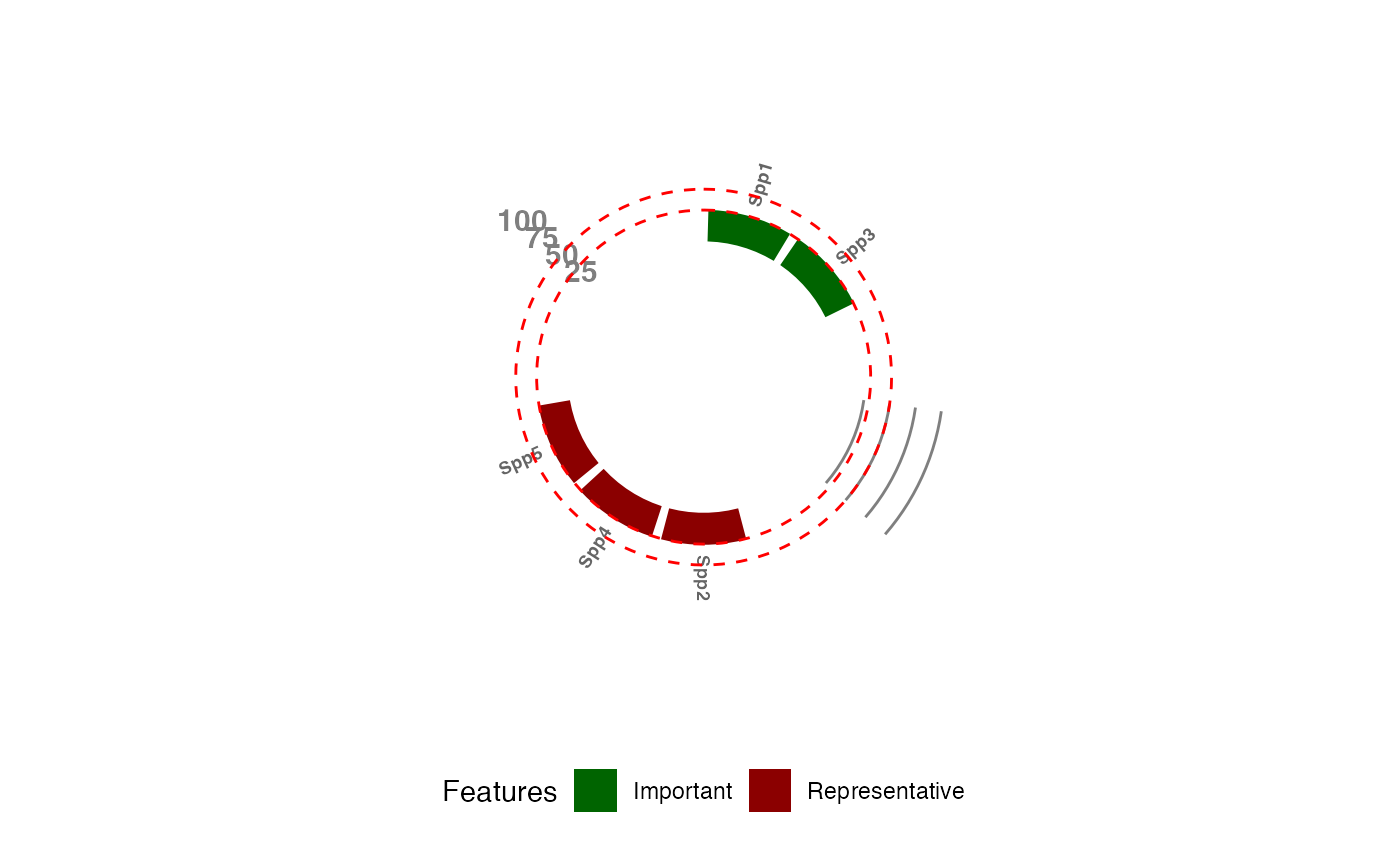
Plot circular barplot
Usage
splnr_plot_circBplot(
  df,
  legend_color,
  legend_list,
  indicateTargets = TRUE,
  impTarget = NA,
  repTarget = NA,
  colTarget = "red"
)
Arguments
- df
data frame that should have the following column names: feature, value, group
- legend_color
vector list of colors; should have the group names and their corresponding colors
- legend_list
list of groups/legends of groups
- indicateTargets
logical on whether to show where the targets were set
- impTarget
target of the important features (in %)
- repTarget
target of the representative features (in %)
- colTarget
string with a colour value for the indicator line
Examples
# DISCLAIMER: THIS SOLUTION IS NOT ACTUALLY RUN WITH THESE TARGETS YET

dat_problem <- prioritizr::problem(dat_species_bin %>% dplyr::mutate(Cost = runif(n = dim(.)[[1]])),
  features = c("Spp1", "Spp2", "Spp3", "Spp4", "Spp5"),
  cost_column = "Cost"
) %>%
  prioritizr::add_min_set_objective() %>%
  prioritizr::add_relative_targets(0.3) %>%
  prioritizr::add_binary_decisions() %>%
  prioritizr::add_default_solver(verbose = FALSE)

dat_soln <- dat_problem %>%
  prioritizr::solve.ConservationProblem()

s1 <- dat_soln %>%
  tibble::as_tibble()

p1 <- dat_problem

df_rep_imp <- prioritizr::eval_feature_representation_summary(
  p1,
  s1[, "solution_1"]
) %>%
  dplyr::select(feature, relative_held) %>%
  dplyr::mutate(relative_held = relative_held * 100)

imp_layers <- c("Spp1", "Spp3")

target <- data.frame(feature = c("Spp1", "Spp2", "Spp3", "Spp4", "Spp5")) %>%
  dplyr::mutate(class = dplyr::if_else(.data$feature %in% imp_layers,
    "important", "representative"
  )) %>%
  dplyr::mutate(target = dplyr::if_else(class == "important",
    50 / 100, 30 / 100
  ))

df <- merge(df_rep_imp, target) %>%
  dplyr::select(-target) %>%
  na.omit() %>%
  dplyr::rename(value = relative_held) %>%
  dplyr::rename(group = class)

colors <- c(
  "important" = "darkgreen",
  "representative" = "darkred"
)
legends <- c("Important", "Representative")

(splnr_plot_circBplot(df,
  legend_list = legends,
  legend_color = colors,
  impTarget = 50, repTarget = 30
))
#> Warning: Removed 4 rows containing missing values or values outside the scale range
#> (`geom_bar()`).
#> Warning: Removed 6 rows containing missing values or values outside the scale range
#> (`geom_text()`).