(For now can replace splnr_plot_cost(), splnr_plot_binFeature(), splnr_plot_MPAs(), splnr_plot_featureNo())
Usage
splnr_plot(
  df,
  col_names = NULL,
  paletteName = "YlGnBu",
  colourVals = c("#c6dbef", "#3182bd"),
  plot_title = "",
  legend_title = NULL,
  legend_labels = NULL
)
Arguments
- df
The dataframe containing the data to be plotted. It must include a geometry column to be used with geom_sf.
- col_names
A list of column names to include in the plot. If specified, only these columns will be used to colour the plot.
- paletteName
The name of the colour palette to use for filling. Default is "YlGnBu".
- colourVals
The colour values to use if col_names is specified and the data is binary.
- plot_title
The title of the plot.
- legend_title
The title of the legend.
- legend_labels
A vector of strings containing the labels to use for legend values.
Examples
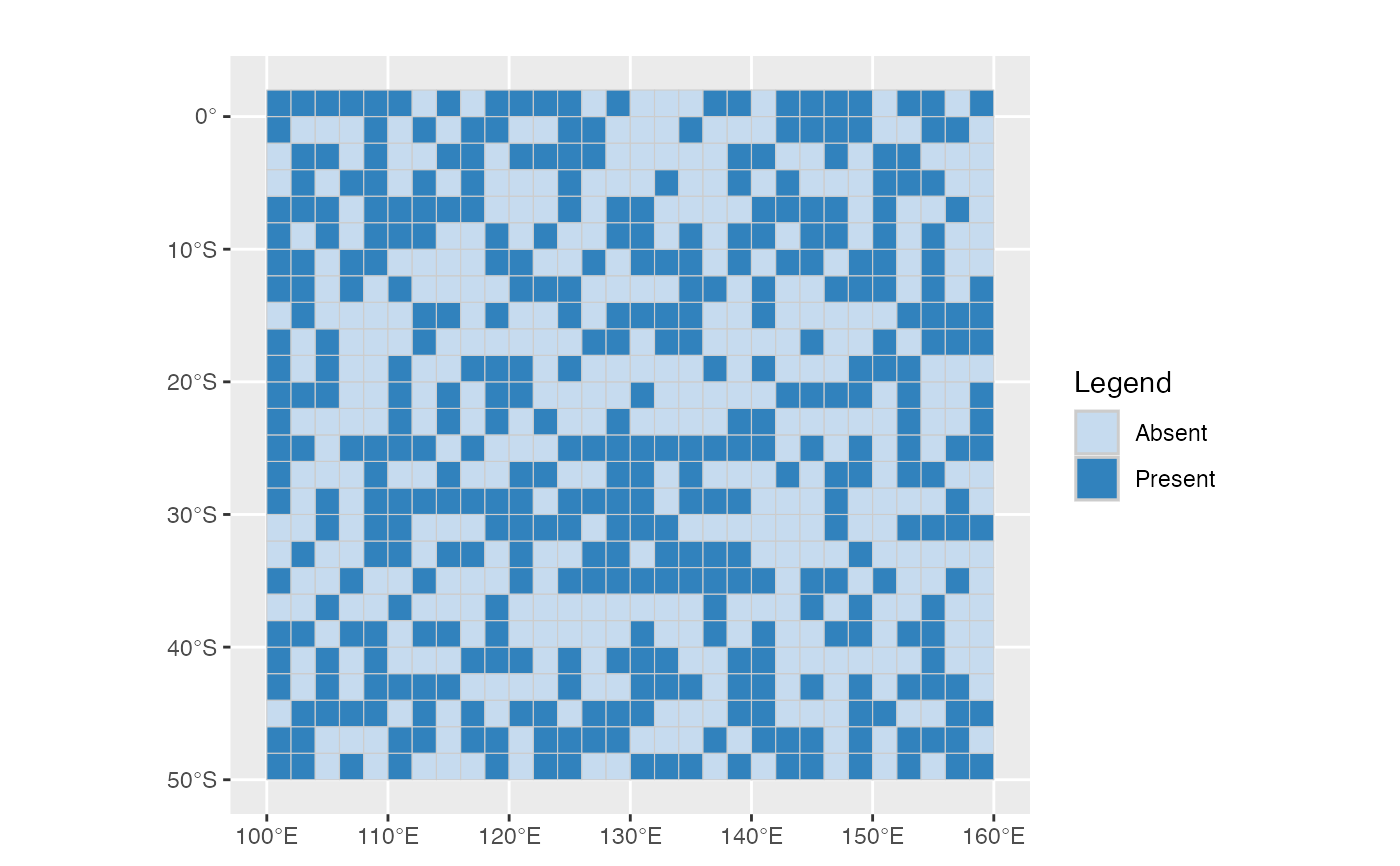
# Binary plot of species distribution
splnr_plot(df = dat_species_bin,
col_names = "Spp1",
legend_title = "Legend",
legend_labels = c("Absent", "Present"))
#> Coordinate system already present. Adding new coordinate system, which will
#> replace the existing one.
 # Logical plot of species distribution
splnr_plot(df = dat_species_bin %>%
dplyr::mutate(dplyr::across(
tidyselect::starts_with("Spp"), as.logical)),
col_names = "Spp1",
legend_title = "Legend",
legend_labels = c("Absent", "Present"))
#> Coordinate system already present. Adding new coordinate system, which will
#> replace the existing one.
# Logical plot of species distribution
splnr_plot(df = dat_species_bin %>%
dplyr::mutate(dplyr::across(
tidyselect::starts_with("Spp"), as.logical)),
col_names = "Spp1",
legend_title = "Legend",
legend_labels = c("Absent", "Present"))
#> Coordinate system already present. Adding new coordinate system, which will
#> replace the existing one.
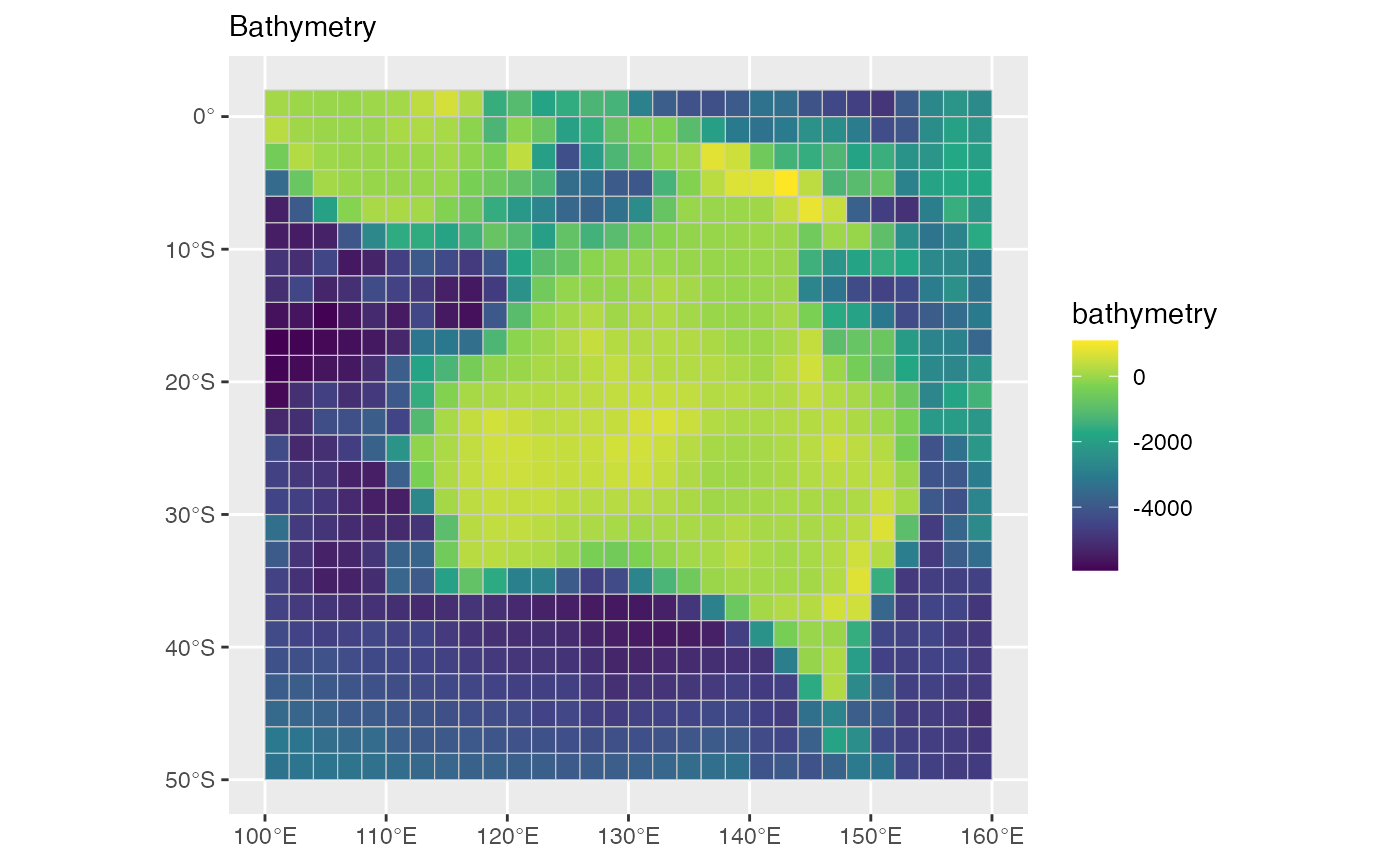
 # Continuous plot of bathymetry#
splnr_plot(df = dat_bathy,
col_names = "bathymetry",
plot_title = "Bathymetry",
legend_title = "Bathymetry (m)")
#> Coordinate system already present. Adding new coordinate system, which will
#> replace the existing one.
# Continuous plot of bathymetry#
splnr_plot(df = dat_bathy,
col_names = "bathymetry",
plot_title = "Bathymetry",
legend_title = "Bathymetry (m)")
#> Coordinate system already present. Adding new coordinate system, which will
#> replace the existing one.
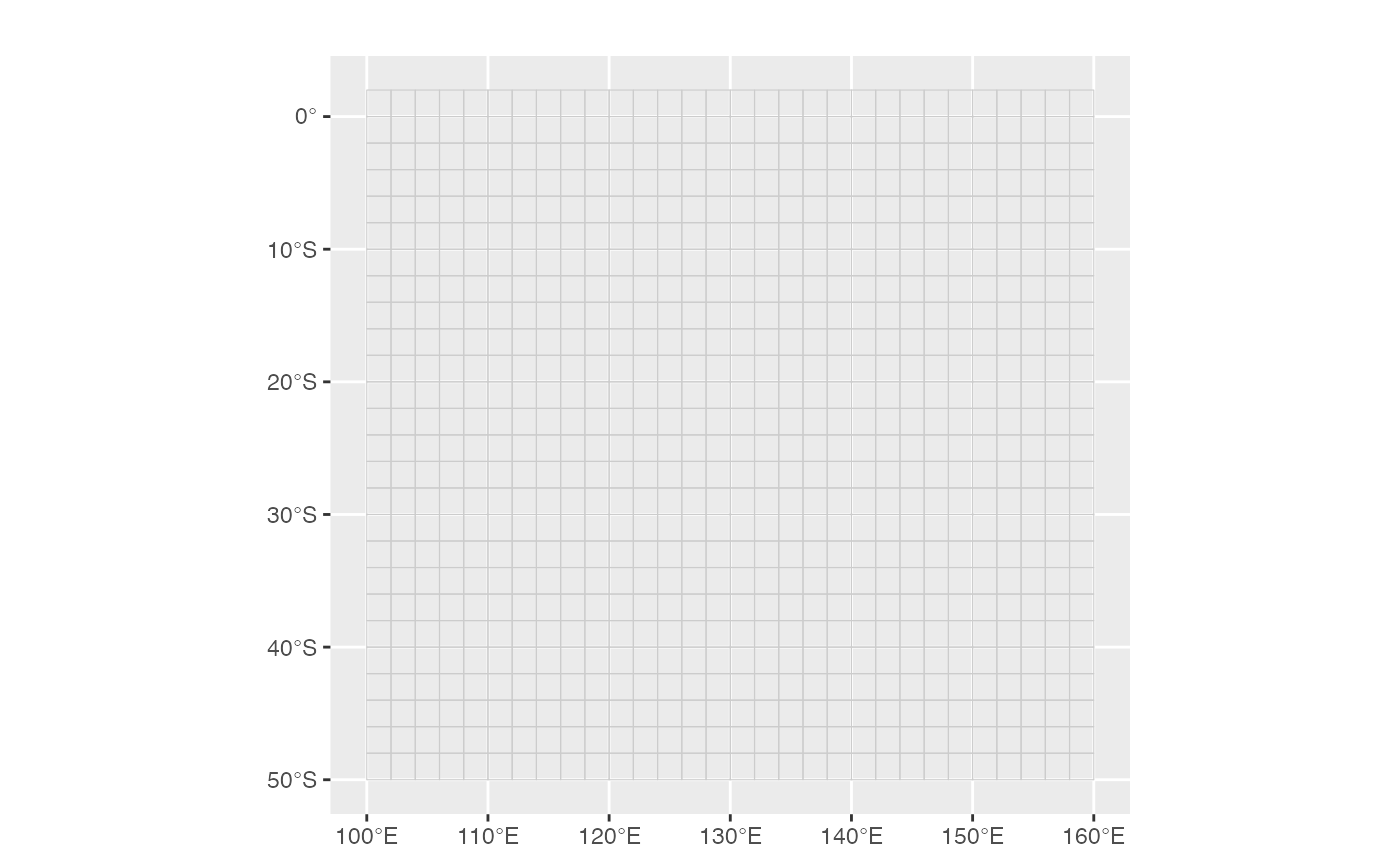
 # Plot Planning Units
splnr_plot(df = dat_PUs)
#> Coordinate system already present. Adding new coordinate system, which will
#> replace the existing one.
# Plot Planning Units
splnr_plot(df = dat_PUs)
#> Coordinate system already present. Adding new coordinate system, which will
#> replace the existing one.
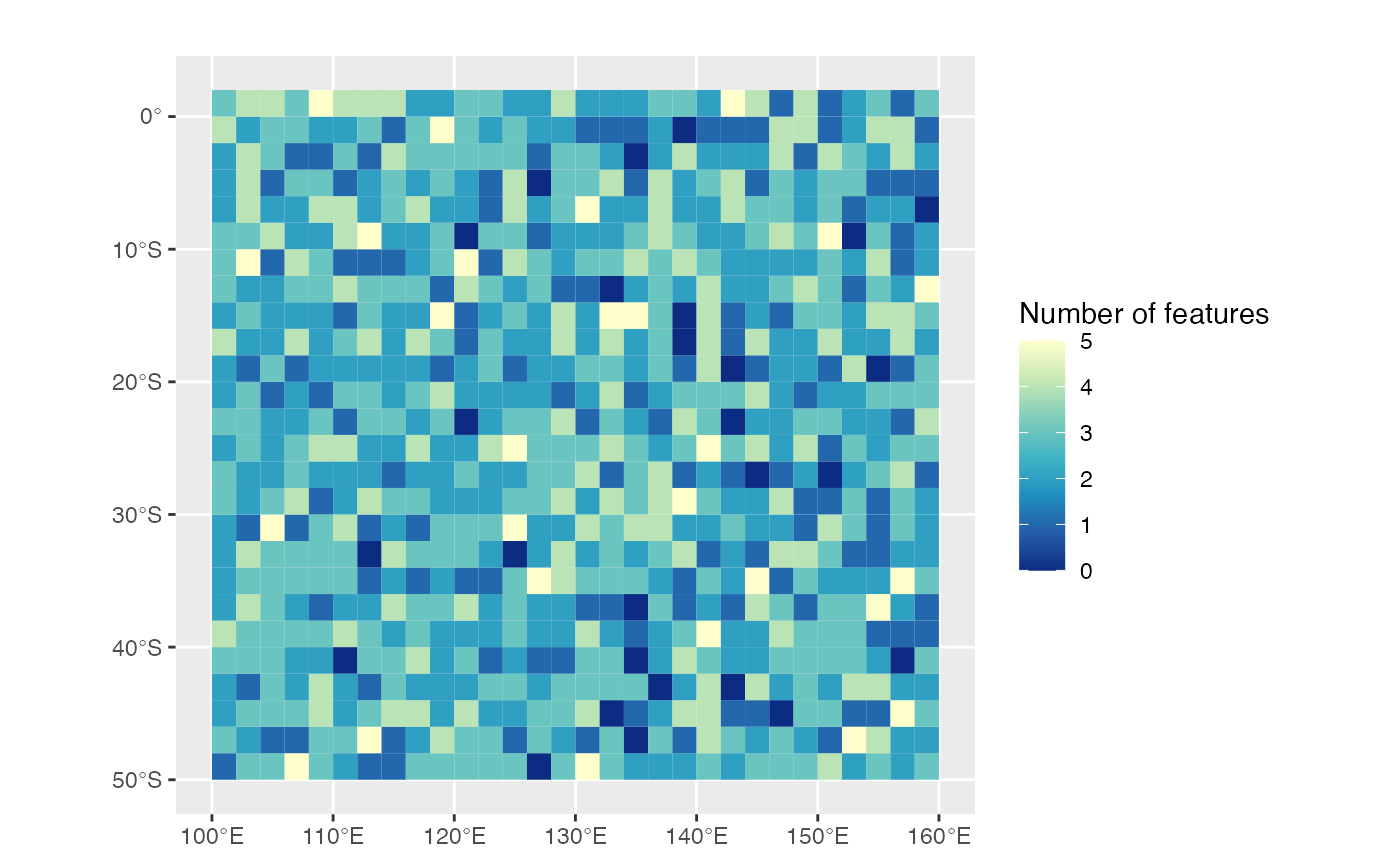
 # Multi binary features
splnr_plot(df = dat_species_bin,
col_names = colnames(dat_species_bin %>%
sf::st_drop_geometry() %>%
dplyr::select(
tidyselect::starts_with("Spp"))),
legend_title = "Number of features")
#> Coordinate system already present. Adding new coordinate system, which will
#> replace the existing one.
# Multi binary features
splnr_plot(df = dat_species_bin,
col_names = colnames(dat_species_bin %>%
sf::st_drop_geometry() %>%
dplyr::select(
tidyselect::starts_with("Spp"))),
legend_title = "Number of features")
#> Coordinate system already present. Adding new coordinate system, which will
#> replace the existing one.